
Linear Distortion Maps
Below are maps showing linear distortion and performance statistics for SPCS2022 zones (click on the maps to get higher resolution versions). Maps of existing SPCS 83 zones are also provided for comparison with SPCS2022.
Not all maps use the same increment for distortion symbology, because distortion can vary greatly in different zones. However, the symbology is the same for adjacent SPCS2022 and SPCS 83 maps to facilitate comparison.
See also:
- Online interactive distortion and zone web maps of beta SPCS2022 Experience
- Beta version of the NGS Coordinate Conversion and Transformation Tool (beta NCAT)
CONUS SPCS2022 statewide zones (200 ppm)

CONUS SPCS2022 statewide zones (50 ppm)

CONUS SPCS2022 multizone complete (50 ppm)

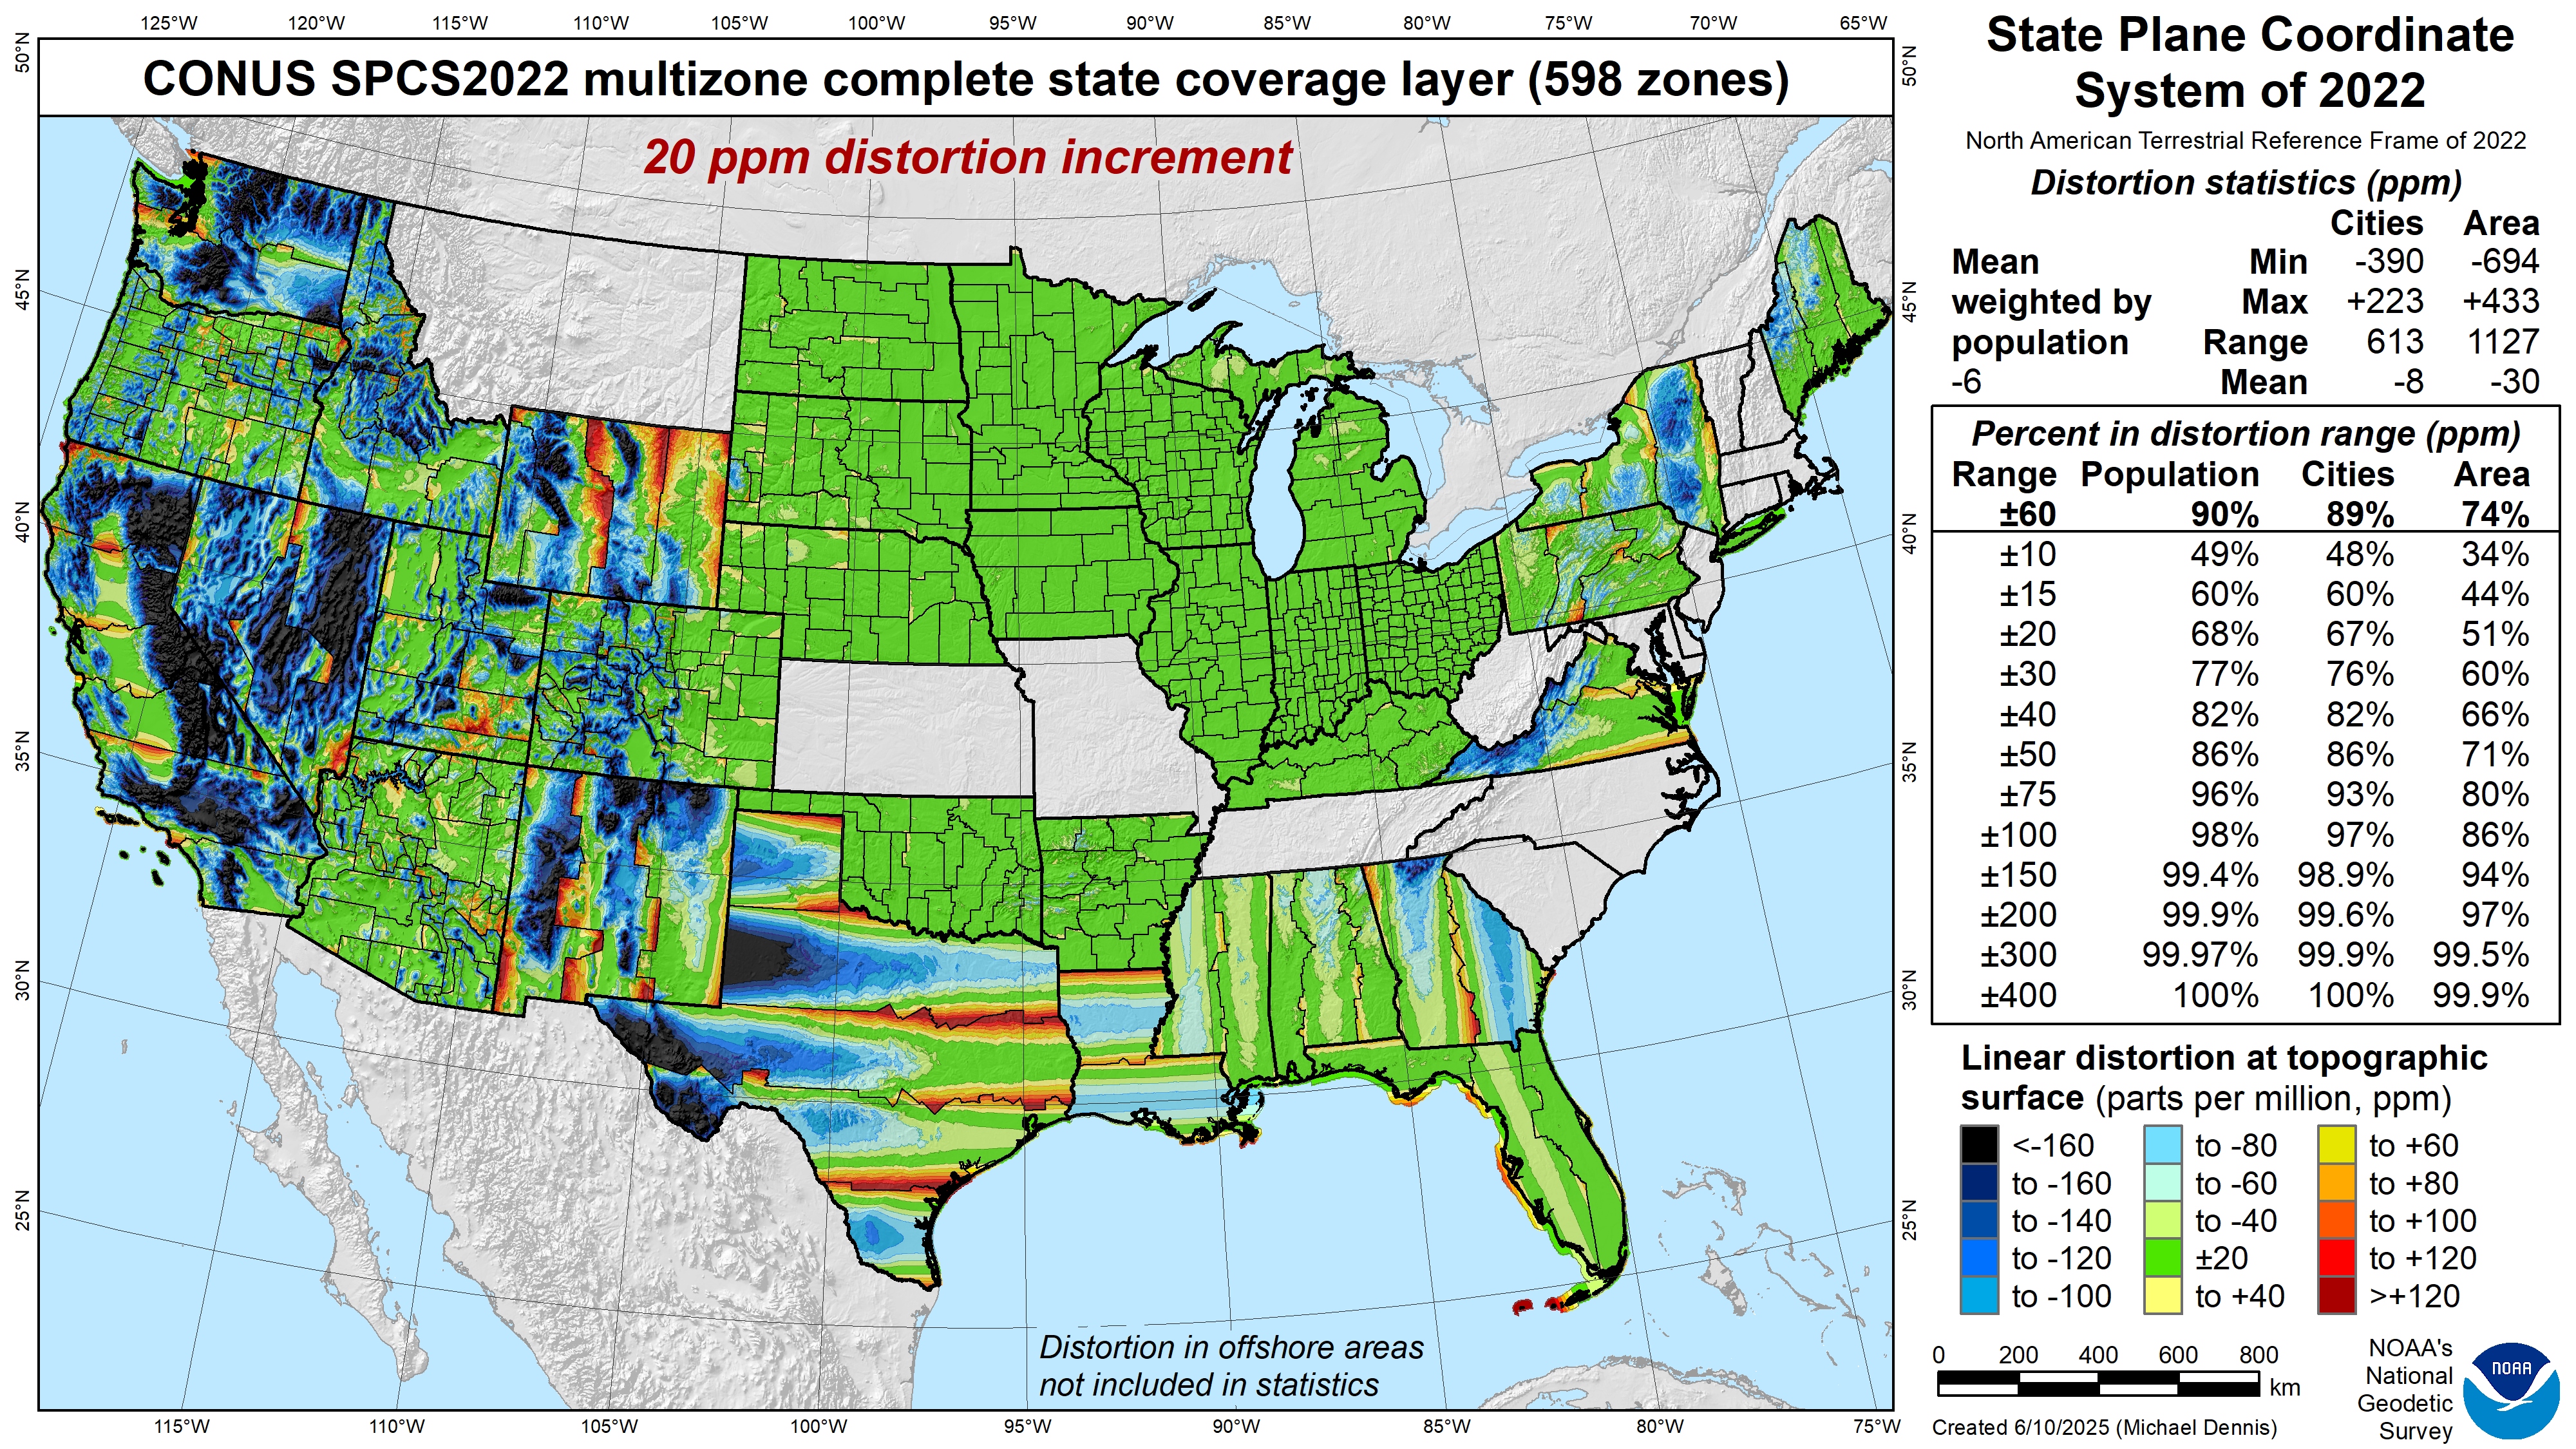
CONUS SPCS2022 multizone complete (20 ppm)
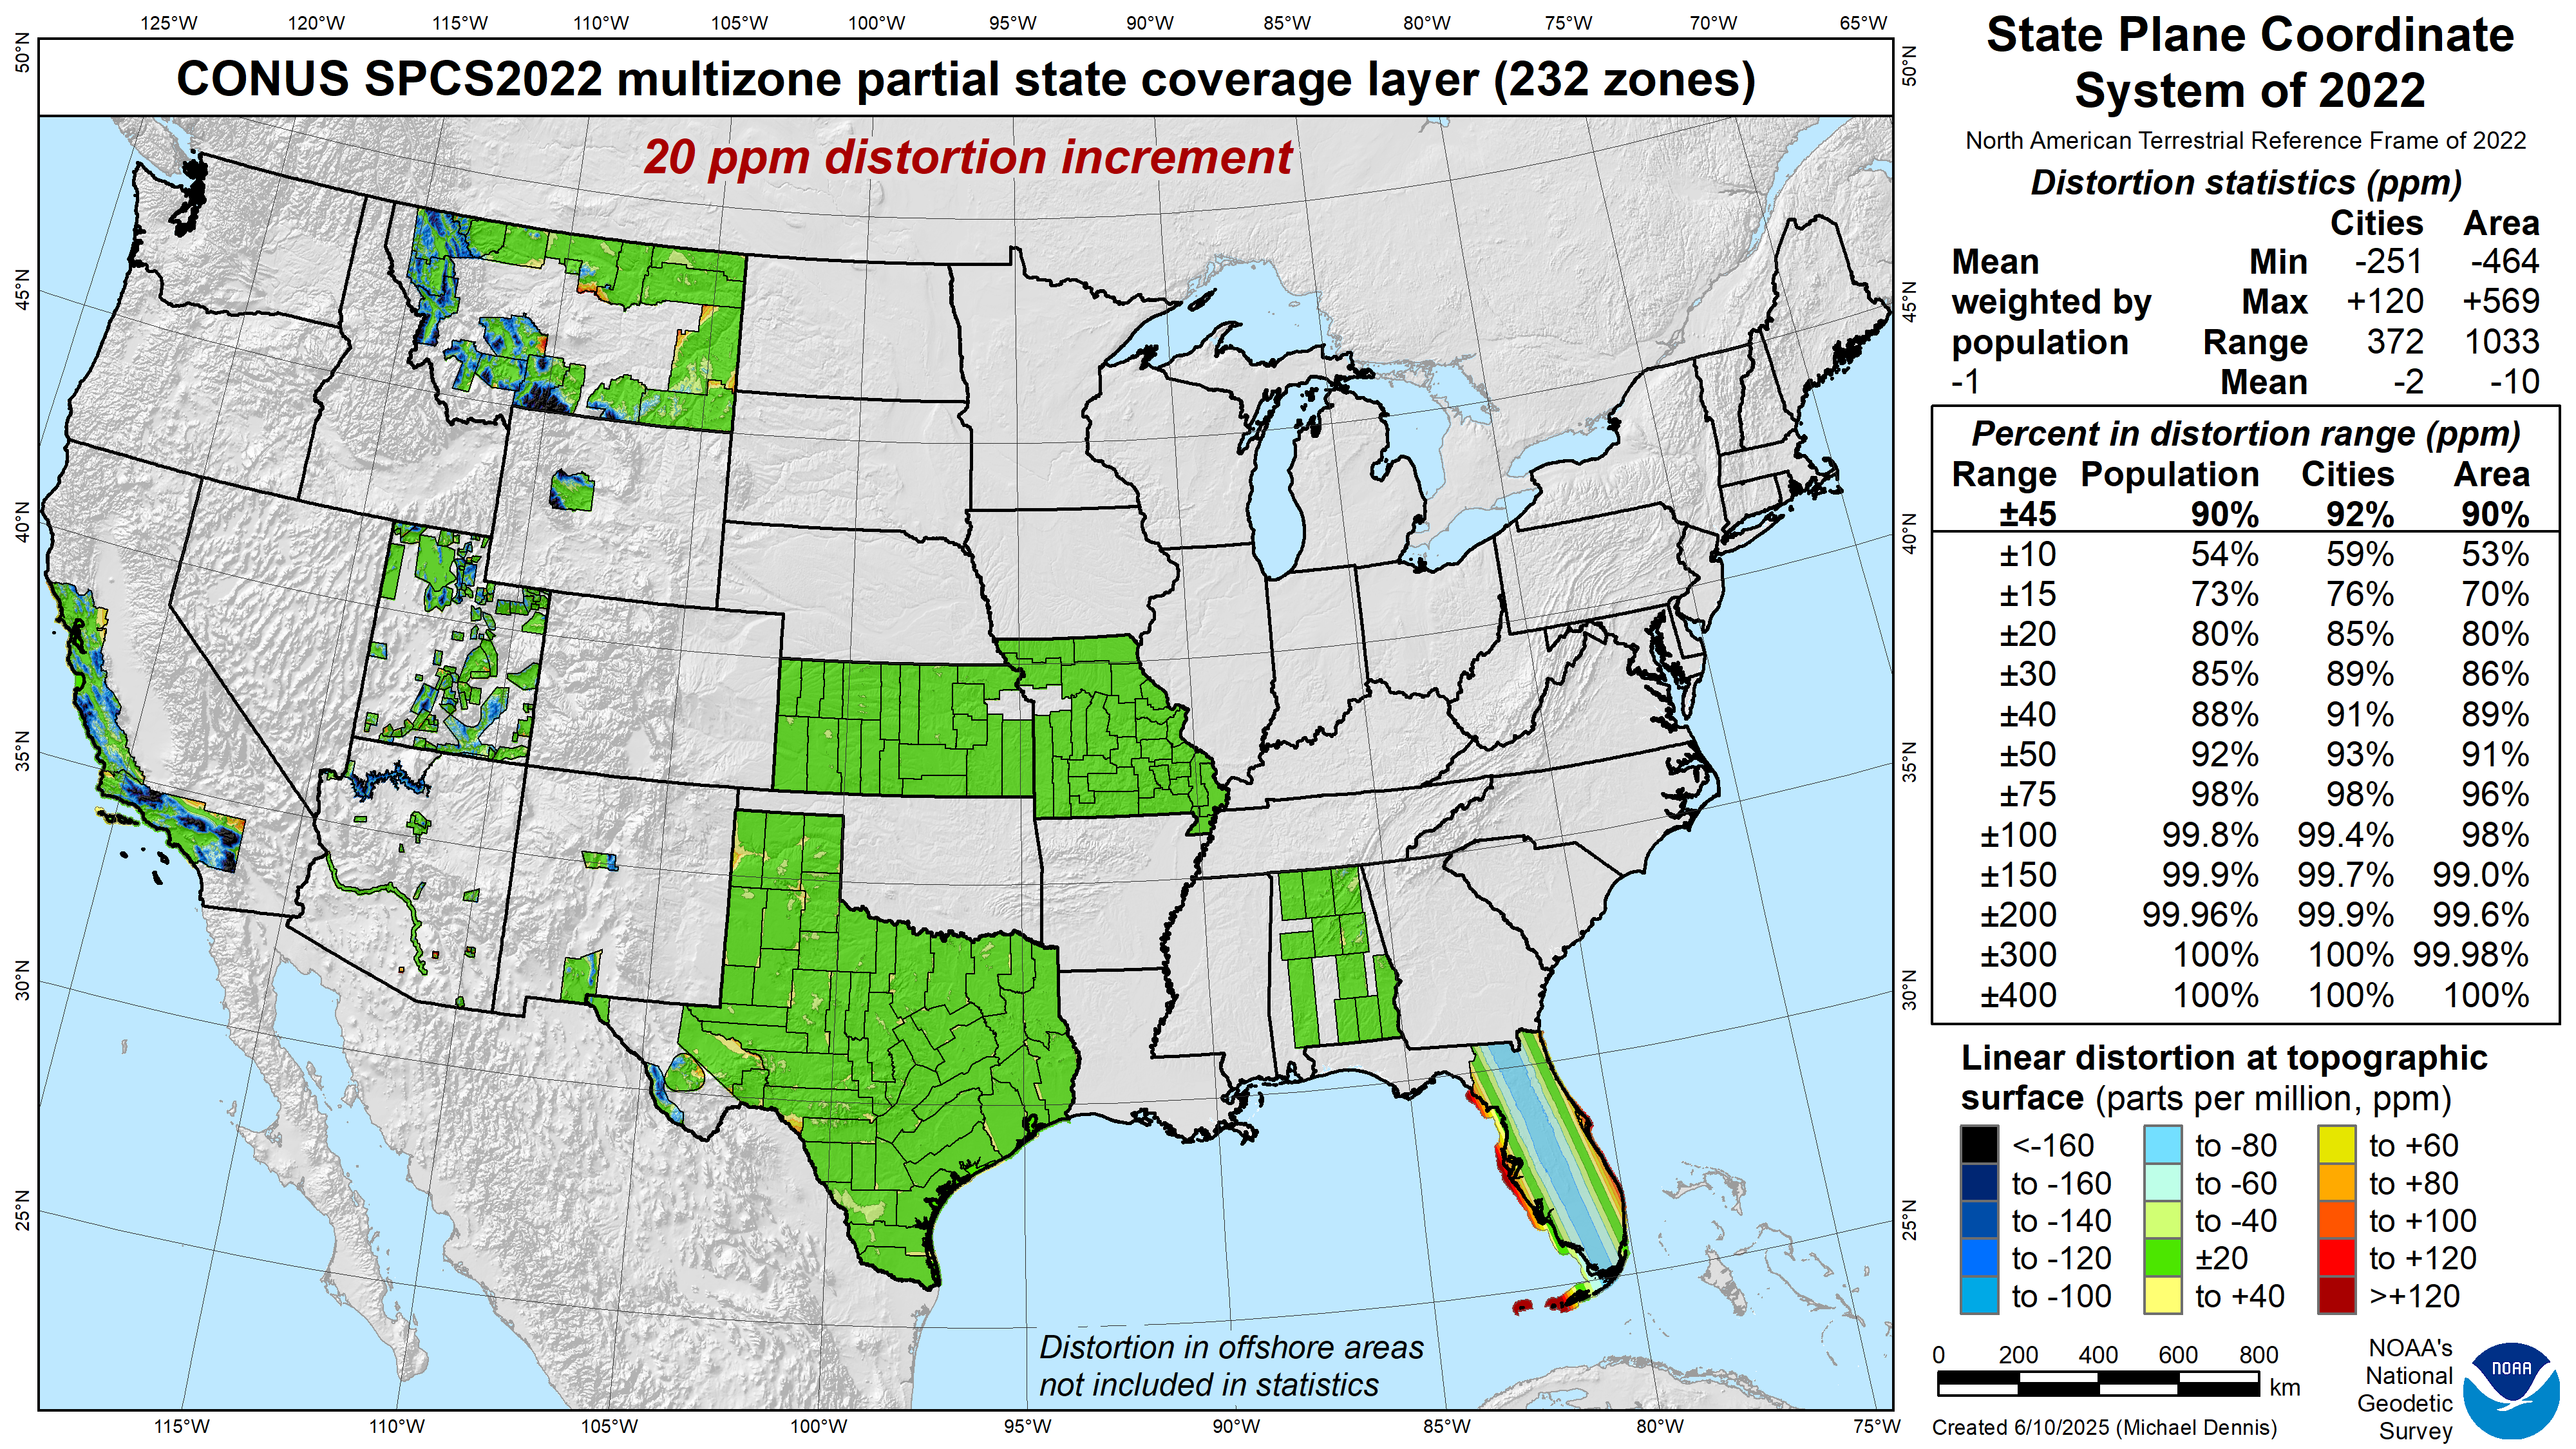
CONUS SPCS2022 multizone partial (20 ppm)
SPCS2022 special use with Gulf multizones (50 ppm)

SPCS2022 special use with Gulf single zone (50 ppm)

All CONUS SPCS2022 zones layers (20 ppm)

All CONUS SPCS2022 zones layers (50 ppm)

All CONUS SPCS 83 zones (50 ppm)

Alaska SPCS2022 statewide zone (1000 ppm)

Alaska SPCS2022 multizone complete (50 ppm)

Alaska SPCS2022 multizone complete (20 ppm)

Alaska SPCS2022 multizone partial (20 ppm)

Both Alaska SPCS2022 multizone layers (50 ppm)

All Alaska SPCS 83 zones (50 ppm)
